Introduction to Candlestick Charts and Indicators
Candlestick Charts and Indicators: practical note
Candlestick Charts and Indicators is one of the most practical approaches for traders on Binomo.  Learn more on Binomo.
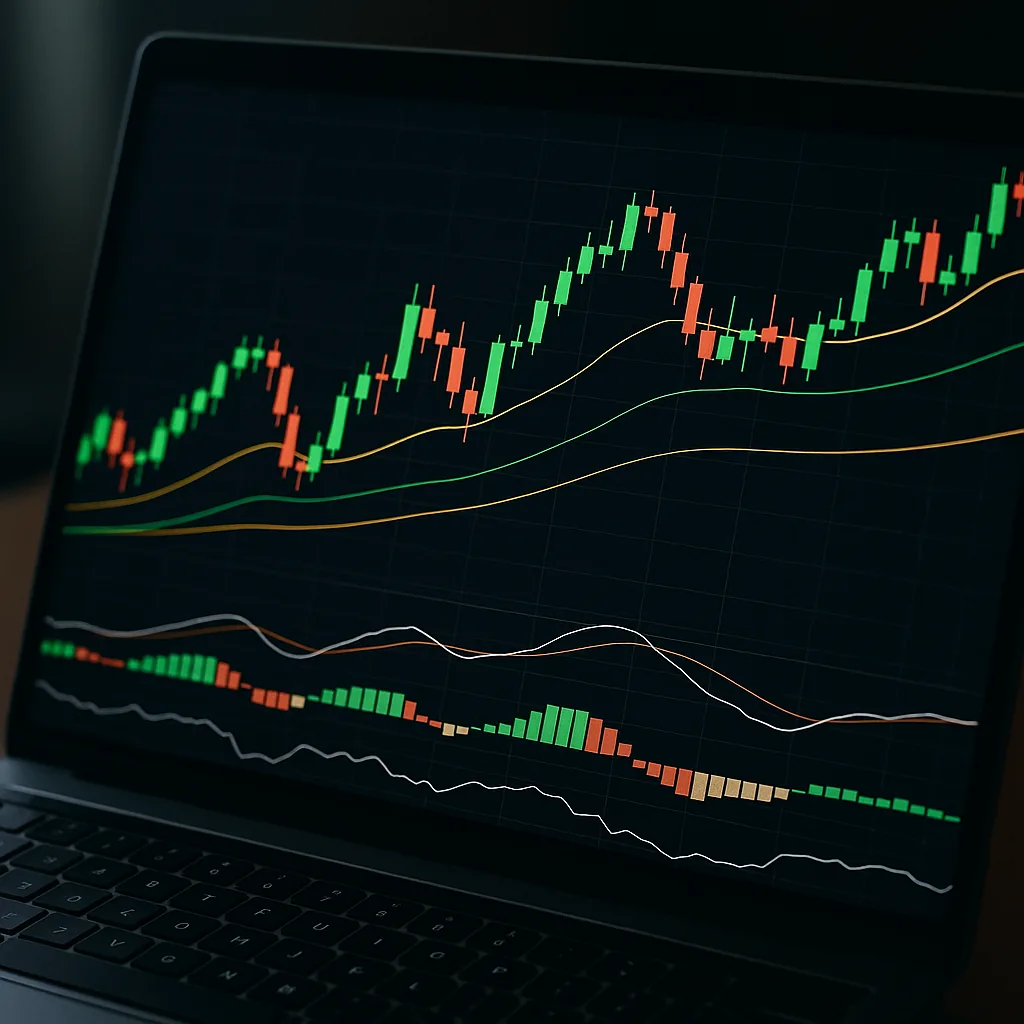
Candlestick Charts and Indicators are fundamental tools every serious trader must master to navigate the markets effectively. Originating from Japan, candlestick charts have become indispensable in modern trading due to their ability to convey price action visually and intuitively. Unlike traditional line or bar charts, candlesticks reveal the open, high, low, and close prices within a specific time frame, offering a richer context for decision-making.
History and importance in trading
The candlestick charting technique dates back to the 18th century, developed by Japanese rice traders. Its adoption in Western markets surged after Steve Nison’s popularization of candlestick patterns in the 1990s. Today, these charts are valued for their psychological insights into market sentiment, helping traders anticipate potential reversals or continuations.
Basic components of a candlestick
Each candlestick consists of a body and wicks (or shadows). The body represents the range between the opening and closing prices, while the wicks indicate the highest and lowest prices during the time interval. A filled or colored body typically denotes a price decrease, whereas a hollow or lighter body shows a price increase.
How candlestick charts differ from other chart types
Unlike line charts that only connect closing prices, candlestick charts provide more granular information by encompassing four data points per interval. This makes it easier to spot patterns and trends, especially when combined with technical indicators.
Key Candlestick Patterns Every Trader Should Know

Mastering Candlestick Charts and Indicators means recognizing essential patterns that signal market sentiment shifts. These patterns can significantly improve your timing on entries and exits.
Bullish and bearish engulfing patterns
The bullish engulfing pattern occurs when a small bearish candle is followed by a larger bullish candle that completely engulfs the previous one, signaling potential upward momentum. Conversely, the bearish engulfing pattern suggests possible downward pressure when a large bearish candle engulfs a smaller bullish one.
Doji and spinning top signals
Doji candles, characterized by nearly equal open and close prices, indicate indecision in the market. Spinning tops have small bodies with longer wicks, also reflecting uncertainty. Spotting these can alert traders to possible trend reversals or consolidations.
Hammer and shooting star formations
The hammer is a bullish reversal pattern with a small body and long lower wick, often found at the bottom of downtrends. The shooting star is its bearish counterpart, with a long upper wick and small body, appearing near market tops.
Essential Technical Indicators for Binary Options

Along with Candlestick Charts and Indicators, technical tools like Moving Averages, RSI, and Bollinger Bands are crucial for enhancing your trading strategy on the Binomo trading platform.
Moving Averages (MA) and their types
Moving Averages smooth out price data to identify the trend direction. Simple Moving Averages (SMA) calculate the average price over a set period, while Exponential Moving Averages (EMA) give more weight to recent prices, making them more responsive.
Relative Strength Index (RSI)
The RSI measures the speed and change of price movements, oscillating between 0 and 100. Values above 70 typically indicate overbought conditions, while below 30 suggest oversold scenarios, helping traders spot potential reversal points.
Bollinger Bands basics
Bollinger Bands consist of a middle SMA line and two outer bands representing standard deviations. They gauge volatility and potential price breakouts, with price touching the bands often signaling overextension.
Combining Candlestick Charts and Indicators with Patterns for Better Accuracy
Effective trading on the Binomo trading platform involves integrating Candlestick Charts and Indicators to confirm signals and reduce false entries.
Confirming signals with RSI
For example, a bullish engulfing pattern near an RSI below 30 strengthens the case for an upward move. This dual confirmation increases confidence in trade decisions.
Using Moving Averages to identify trends
Moving Averages help filter trades by trend direction. Entering trades aligned with the MA trend—buying above an upward MA and selling below a downward MA—improves success rates.
Volatility assessment with Bollinger Bands
Bollinger Bands indicate periods of low or high volatility. A candlestick breakout beyond the bands can signal a strong move, especially when supported by other indicators.
How to trade this on Binomo trading platform
Mastering Candlestick Charts and Indicators is only valuable if applied correctly on your platform. Here’s how to set up and trade using Binomo‘s tools.
Step 1: Setting up candlestick charts on Binomo
Log into your Binomo trading platform and select the asset you want to trade. Choose the candlestick chart type from the chart options to visualize price movements clearly. Candlestick Charts and Indicators provide the clarity needed for precise analysis.
Step 2: Applying and customizing technical indicators
Add Moving Averages, RSI, and Bollinger Bands via the indicators menu. Customize the parameters to suit your trading style and timeframe.
Step 3: Identifying trade entry and exit points
Look for candlestick patterns confirmed by indicator signals to decide when to enter or exit trades. For instance, a hammer candlestick near the lower Bollinger Band with RSI below 30 may indicate a buy opportunity. Candlestick Charts and Indicators help you interpret these signals effectively.
🚀 Ready to test this strategy? Sign up for a free Demo Account on Binomo today.
Common Mistakes to Avoid When Using Candlestick and Indicators
Even experienced traders can fall into traps while using Candlestick Charts and Indicators. Avoid these pitfalls to protect your capital.
Overtrading based on single signals
Relying solely on one candlestick or indicator signal without confirmation often leads to false entries. Always seek multiple confirmations.
Ignoring market context and news
Technical analysis is powerful but can be overridden by major news events or broader market trends. Stay informed and adapt accordingly.
Misinterpreting indicator lag
Indicators like Moving Averages lag price action. Misreading them can cause delayed or premature trades. Use them in conjunction with price patterns.
Advanced Tips for Veteran Traders
For those with solid experience, combining Candlestick Charts and Indicators with advanced methods can enhance precision and profitability.
Integrating volume analysis with candlestick patterns
Volume confirms the strength behind price moves. Higher volume on a reversal candlestick pattern adds validity to the signal.
Using multiple time frame analysis
Analyzing charts across different time frames helps identify stronger trends and better entry points, reducing noise from short-term fluctuations.
Backtesting strategies on Binomo
Use Binomo’s demo account to backtest your candlestick and indicator strategies. This practice refines your approach without risking real money.
Conclusion and Next Steps
Mastering Candlestick Charts and Indicators is essential for any trader aiming to improve their technical analysis skills. By understanding key patterns and integrating reliable indicators like RSI and Moving Averages, you gain a tactical edge on the Binomo trading platform.
Summary of key takeaways
Focus on combining candlestick patterns with technical indicators for confirmation, avoid common mistakes like overtrading, and embrace continuous learning.
Continuous learning and practice recommendations
Regularly review your trades and refine your strategy. Utilize resources like the Complete Guide to Binomo Trading Strategies and Risk Management Fundamentals to enhance your skills.
How Binomo supports your trading journey
Binomo offers an intuitive platform with customizable charts and indicators to execute these strategies effectively. Coupled with its demo account, it’s ideal for honing your craft before trading live.
For more on technical indicators, see our guide on How to Use Moving Averages, MACD, and RSI Indicators on Binomo for Profitable Trades.
For a deeper understanding of technical analysis fundamentals, visit Investopedia’s Candlestick Explanation.
Disclaimer: This article is for informational purposes only and does not constitute financial advice. Always consult a qualified financial professional before making investment decisions.